What is the trend of a specific topic, such as a new brand or a current issue happening somewhere in the world? This post shows how to answer this question, and several similar, using a streaming pipeline and an analytic dashboard powered by Twitter Streaming API, Solr, Logstash and Banana.
Coronavirus (COVID-19) Live Demo 1330
Prerequisites
In order to obtain a stream from Twitter, you need to have a developer account and a Twitter application. Each Twitter application is assigned customer keys that are used as credentials for authentication and authorization API calls.
Twitter offers several endpoints that allows interaction with the platform. The one used here is statuses/filter which streams tweets that match specific filters.
Docker Compose
docker-compose allows defining and running multi-container connected applications which is the common pattern of modern systems. This post illustrates how can Docker Compose be used to achieve that and answer the preceding question.
The docker-compose file that is needed is listed here:
# Copyright 2020
#
# Licensed under the Apache License, Version 2.0 (the "License");
# you may not use this file except in compliance with the License.
# You may obtain a copy of the License at
#
#    http://www.apache.org/licenses/LICENSE-2.0
#
# Unless required by applicable law or agreed to in writing, software
# distributed under the License is distributed on an "AS IS" BASIS,
# WITHOUT WARRANTIES OR CONDITIONS OF ANY KIND, either express or implied.
# See the License for the specific language governing permissions and
# limitations under the License.

version: '3.7'

services:
  solr:
    image: solr:8.2.0
    ports:
      - 8983:8983
    volumes:
      - ./volumes/solr/configsets:/opt/configsets
    stdin_open: true
    tty: true
    command: ["solr", "-c", "-f"]

  logstash:
    build: ./logstash-patch
    ports:
      - 5044:5044
    volumes:
      - ./volumes/logstash/config:/usr/share/logstash/config
      - ./volumes/logstash/xbin:/usr/share/logstash/xbin
      - ./volumes/logstash/xplugins:/usr/share/logstash/xplugins
    links:
      - solr
    depends_on:
      - solr
    stdin_open: true
    tty: true
    command: ["xbin/wait-for-it.sh", "solr:8983", "-s", "-t", "60", "--", "/usr/share/logstash/xbin/setup.sh"]

  banana:
    image: aaadel/banana
    ports:
      - 9901:9901
    environment:
      BANANA_SOLR_HOST: solr
    links:
      - solr
    depends_on:
      - solr
    stdin_open: true
    tty: true
Here, we are using a simple orchestration mechanism, which is wait-for-it, to synchronize containers running sequence. We are depending on the same directory structure that was introduced in the previous post and also using Solr ingestion and indexing techniques, such as XSLT transformations and schema-less mode. Twitter credentials along with the endpoint parameters are supplied to Logstash Twitter plugin.
Decomposing Quoted Statuses
The tweets stream objects often comes with embedded objects, which Twitter calls quoted statuses. These quoted statuses are usually as significant or more as the original tweet. Since we are interested in these quoted statuses and we are using the default schema which does not support nested documents, a filter is required to decompose these quoted statuses and index them as original tweets. A Ruby filter fits exactly here. The following snippet decomposes quoted status, if it exists, adding it to a new event using field reference syntax and passes it in the returned events array.
# the value of `params` is the value of the hash passed to `script_params`
# in the logstash configuration
def register(params)
end

def filter(event)
  if event.get("quoted_status")
    quoted_status_event = LogStash::Event.new
    quoted_status = event.get("quoted_status")
      class << quoted_status
        def nested_each_pair(path)
	  self.each_pair do |k, v|
	    path << k
            if v.is_a?(Hash)
              v.nested_each_pair(path)
              {|path, k, v| yield path, k, v}
	    else
              yield(path, k, v)
            end
          path.pop
        end
      end
    end

    quoted_status.nested_each_pair([]) {|path, k, v|
	field_ref = path.reduce("") { |memo, e| memo + "[" + e +"]" }
	quoted_status_event.set(field_ref, v)
    }
    return [event, quoted_status_event]
  else
    return [event]
  end
endNote: id_str field should be defined as unique in the schema in order to avoid duplication.
Analytics
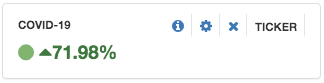
Trend might be the most important metric here. In a Banana dashboard, adding a ticker panel calculates the linear trend estimate as follows:
![\[ trend=\frac{V_{c} - V_{p}}{V_{p}} \]](https://aadel.io/blog/wp-content/ql-cache/quicklatex.com-9c92711ac12754b03588e7d47f555c5c_l3.png "Rendered by QuickLaTeX.com")
where Vc is the current window volume and Vp is the past window volume as defined in panel settings. Below is the trend of “Coronavirus” and “COVID-19” on March 14, 2020 at 3:00 PM as measured using Twitter stream in a 12 hours sliding window and a 3 hours stride.
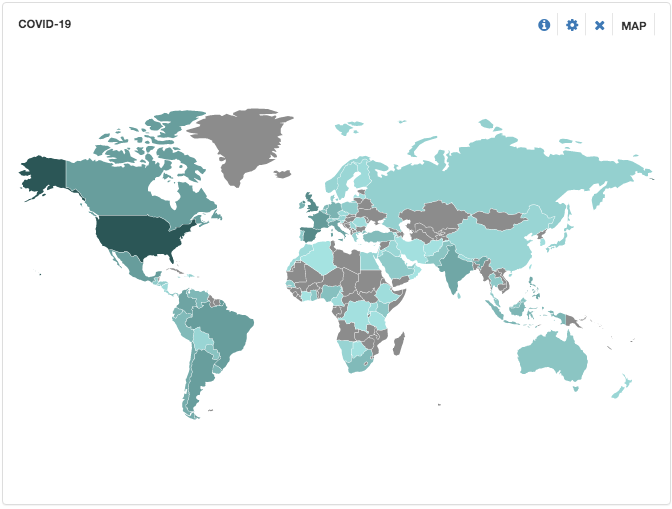
A map can be depicted also for geotagged tweets by supplying place object country_code_s field to the map panel settings. Below is a map of the same time window as above.
The graph below is a realtime timeseries plot of trend values for the past week: