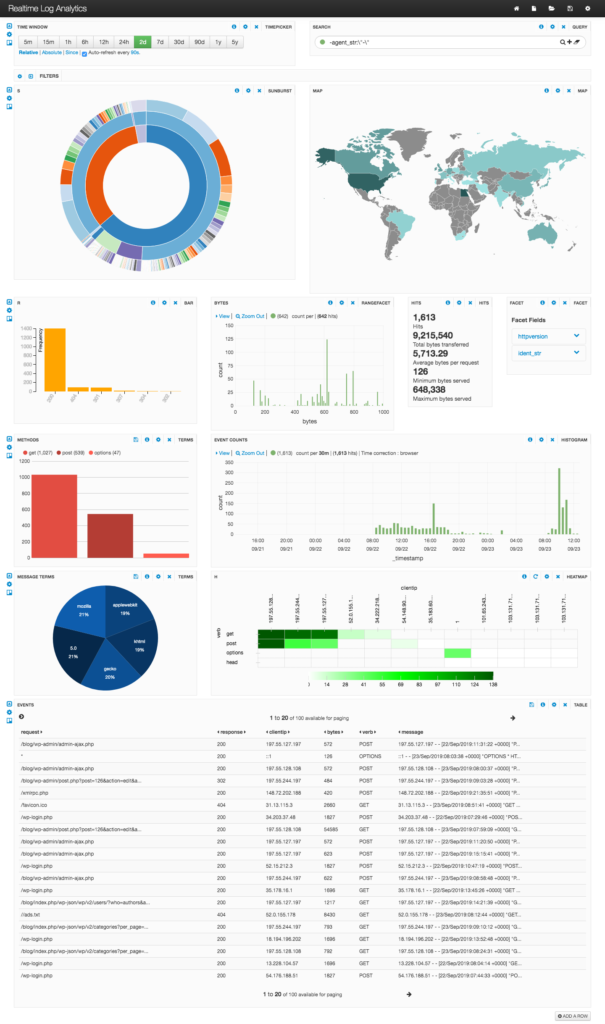
Logs are everywhere and usually generated in large sizes and high velocities. These logs can be used to obtain useful information and insights about the domain or the process related to these logs, such as platforms, transactions, system users, etc. In this post, a realtime web (Apache2) log analytics pipeline will be built using Apache Solr, Banana, Logstash and Beats containers.
However, in order to get the pipeline running, several integration aspects related to streaming data need to be addressed through settings and patches supplied through mounted volumes. The structure of these volumes can be as below:
volumes
 |-solr
   |-configsets
     |-_default
       |-xslt
 |-logstash
   |-xbin
   |-xplugins
     |-solr_http
   |-config
 |-filebeat
 |-banana
Note: volumes/solr/configsets is a copy of $SOLR_HOME/server/solr/configsets
Filebeat
Configure Filebeat
$ docker pull docker.elastic.co/beats/filebeat:7.3.2The latest versions of Filebeat exports extra fields related to ECS which override original Combined Log fields and, additionally, cannot be indexed into Solr directly as they do not follow the standard Solr add document structure. To overcome that, these fields can be dropped here and later downstream recover the overwritten ones, namely agent and host, by Logstash. The following filebeat.yml reflects that:
filebeat.config:
  modules:
    path: ${path_config}/modules.d/*
    reload.enabled: false

processors:
  - drop_fields:
    fields: ["log", "eco", "host", "agent", "input"]

filebeat.inputs:
  type: log
  path:
    - /var/log/apache2/*

output.logstash:
  hosts: ["Logstash:5044"]
Logstash
$ docker pull docker.elastic.co/beats/logstash:7.3.2Configure Logstash
Create logstash-filebeat.yml under volumes/logstash/config directory as follows:
input {
  beats {
    port => 5044
  }
}

filter {
  grok {
    match => { "message" => "%{COMBINEDAPACHELOG}" }
  }
  date {
    match => [ "timestamp", "dd/MM/yyyy:HH:mm:ss Z" ]
  }
  useragent {
    source: "[apache][access][agent]"
    target: "[apache][access][user_agent]"
  }
  geoip {
    source: "clientip"
  }
}

output {
  solr_http {
    id => "solr_plugin_1"
    solr_url => "http://solr:8983/solr/logs"
    tr => "update_geoip.xsl"
  }
}
The settings are straightforward. Beats is used for input, four filters are used to process the stream of data and solr_http plugin is used for output:
grok: extract fields from the payload. The expected format is Apache combined log. There are many other supported formats by this plugin.date: parse timestamp and convert it to an internal representation.useragent: add user agent data.geoip: add geographical data.
solr_http plugin
The latest version of solr_http plugin has some glitches related to JSON structure, ISO8601 time format, and the commit policy which prevents data from being indexed into Solr. The solr_http.rb patch below addresses these glitches, in addition to applying the XSLT:
--- solr_http.rb	2019-09-24 08:56:50.000000000 +0200
+++ /Users/ahmedadel/workspace/volumes/logstash/xplugins/solr_http/solr_http.rb	2019-09-24 09:31:06.000000000 +0200
@@ -39,10 +39,13 @@
   # '%{foo}' so you can assign your own IDs
   config :document_id, :validate => :string, :default => nil

+  # Document transformation XSL
+  config :tr, :validate => :string, :default => nil
+
   public
   def register
     require "rsolr"
-    @solr = RSolr.connect :url => @solr_url
+    @solr = RSolr.connect :url => @solr_url, update_format: :xml
     buffer_initialize(
       :max_items => @flush_size,
       :max_interval => @idle_flush_time,
@@ -62,7 +65,7 @@

     events.each do |event|
         document = event.to_hash()
-        document["@timestamp"] = document["@timestamp"].iso8601 #make the timestamp ISO
+        document["@timestamp"] = document["@timestamp"].to_iso8601 #make the timestamp ISO
         if @document_id.nil?
           document ["id"] = UUIDTools::UUID.random_create    #add a unique ID
         else
@@ -71,7 +74,7 @@
         documents.push(document)
     end

-    @solr.add(documents)
+    @solr.add(documents, :add_attributes => {:commitWithin=>10000}, :params => {:tr => @tr})
     rescue Exception => e
       @logger.warn("An error occurred while indexing: #{e.message}")
   end #def flush
Place the patch under volumes/logstash/xplugins/solr_http/solr_http.rb.patch
Start script
The following shell script can be used to install and patch the plugin before starting Logstash:
#!/usr/bin/sh

cd /usr/share/logstash

yum install -y patch
su - logstash -c "bin/logstash-plugin install logstash-output-solr_http"

# Apply patches for undefined method `iso8601' error and NRT
# PR#9 respectively (https://github.com/logstash-plugins/logstash-output-solr_http/pull/9)
# addressing Issue#10 (https://github.com/logstash-plugins/logstash-output-solr_http/issues/10)
# and PR#7 (https://github.com/logstash-plugins/logstash-output-solr_http/pull/7)

su - logstash -c "cd vendor/bundle/jruby/2.5.0/gems/logstash-output-solr_http-3.0.5/lib/logstash/outputs && patch < /usr/share/logstash/xplugins/solr_http/solr_http.rb.patch"

su - logstash - c "bin/logstash -f /usr/share/logstash/config/logstash-filebeat.conf"
Solr
$ docker pull solrTo take advantage of Solr schemaless mode and field type guessing with Logstash and Banana, guessing settings need to be slightly modified. By default, the supported types are multi-valued which does not play well with Banana as of now, therefore, we will modify solrconfig.xml under volumes/solr/configsets/_default field guessing to be single valued as follows:
<processor class="solr.AddSchemaFieldsUpdateProcessorFactory">
      <str name="defaultFieldType">string</str>
      <lst name="typeMapping">
        <str name="valueClass">java.lang.Boolean</str>
        <str name="fieldType">boolean</str>
      </lst>
      <lst name="typeMapping">
        <str name="valueClass">java.util.Date</str>
        <str name="fieldType">pdate</str>
      </lst>
      <lst name="typeMapping">
        <str name="valueClass">java.lang.Long</str>
        <str name="valueClass">java.lang.Integer</str>
        <str name="fieldType">plong</str>
      </lst>
      <lst name="typeMapping">
        <str name="valueClass">java.lang.Number</str>
        <str name="fieldType">pdouble</str>
      </lst>
</processor>
Although the geoip data, which is generated by Logstash geoip processor, is encoded in one field node, it does not conform with Solr standard add command format. To address this, an XSL transformation can be used to transform it to Solr style structure:
<xsl:stylesheet xmlns:xsl="http://www.w3.org/1999/XSL/Transform" version="2.0">
  <xsl:template match="field[@name='geoip']">
    <field name="country_code2">
      <!-- transform country_code2 only -->
      <xsl:value-of select="@country_code2" />
    </field>
  </xsl:template>
  <xsl:template match="*">
    <xsl:copy>
      <xsl:copy-of select="@*" />
      <xsl:apply-templates />
    </xsl:copy>
  </xsl:template>
</xsl:stylesheet>
In the above XSLT, we are interested in country_code2 field only.
Banana
$ docker pull aaadel/bananaBanana works with this pipeline out-of-the-box, no configuration no modifications!
Starting the pipeline
Preparing the environment
In this step, we create the network required for the stream. Also, as a security measure, Filebeat configuration files should be writable by the owner only:
$ docker network create some network
$ chmod go-w volumes/filebeat/filebeat.yml
Starting the containers
$ docker run --rm --name solr -v volumes/solr/configsets:/opt/configsets --network somenetwork -p 8983:8983 -t solr -c -f $ docker run --rm -it --name logstash -u=0 \
-v volumes/logstash/config:/usr/share/logstash/config \
-v volumes/logstash/xbin:/usr/share/logstash/xbin \
-v volumes/logstash/xplugins:/usr/share/logstash/xplugins \
-v /var/log/apache2:/var/log/apache2 --network somenetwork -p 5044:5044 -t docker.elastic.co/logstash/logstash:7.3.2 xbin/setup.sh$ docker run --rm --name filebeat \
-v volumes/filebeat/filebeat.yml:/usr/share/filebeat/filebeat.yml \
-v /tmp/log:/tmp/log --link logstash --network somenetwork docker.elastic.co/beats/filebeat:7.3.2$ docker run --rm -e "BANANA_SOLR_HOST=solr" --name banana --link solr --network somenetwork -p 9901:9901 -t aaadel/bananaCreating the logs collection
$ docker exec solr bin/solr create -c logs -d /opt/configsets/_defaultLoading a pre-defined dashboard
Now, just load the pre-defined dashboard and navigate to http://localhost:9901. Done!

Of course, additional panels can be created to get more details about the logs being analyzed. The dashboard is realtime by default, which reflects updates in a 30 seconds resolution.
One reply on “Realtime Log Analytics with Solr, Logstash, Banana and Beats”
Теперь буду знать